- DATE:
- AUTHOR:
- PowerSync Product Team
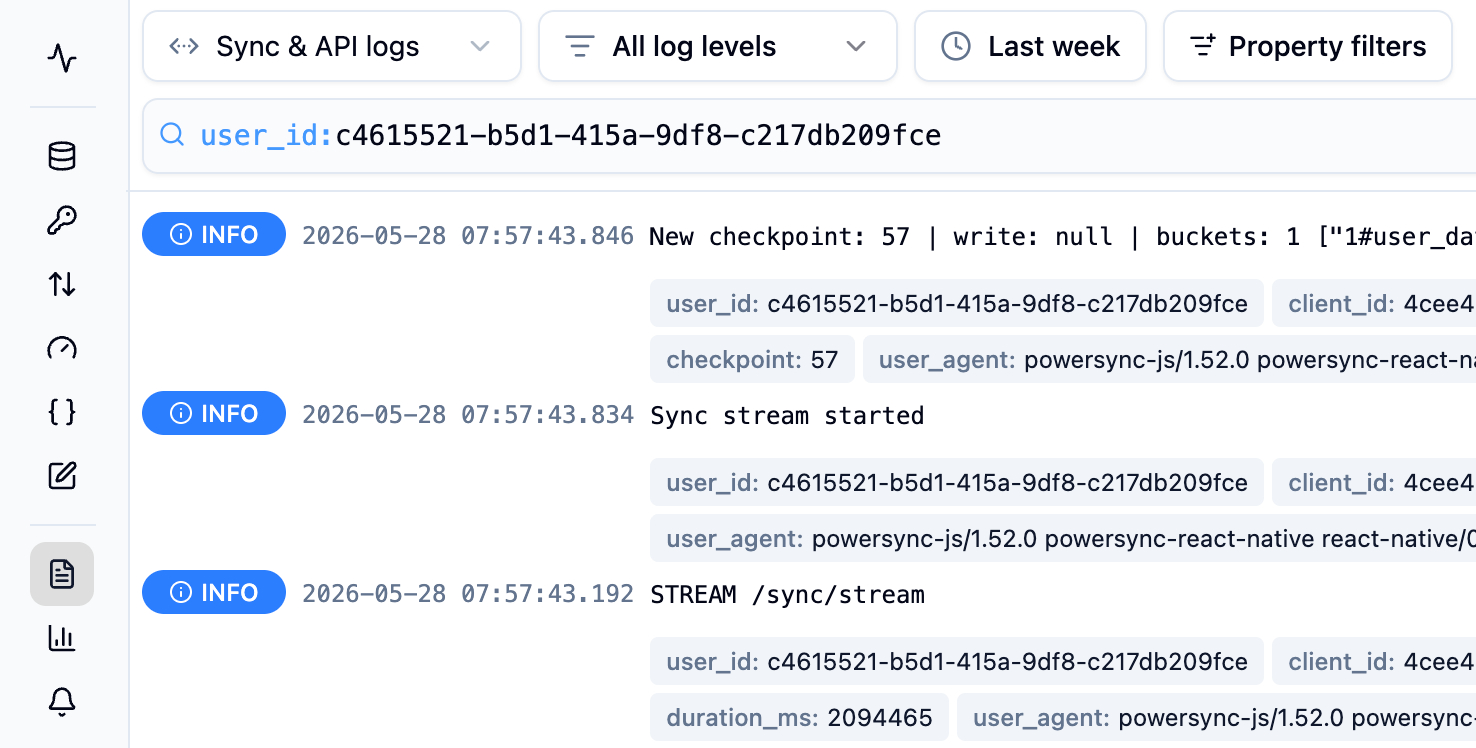
Searchable Instance Logs in the PowerSync Dashboard
Until now, finding the right entries in the PowerSync Dashboard's instance logs meant scrolling the feed or using browser search. That works for the last handful of events but falls apart once you're investigating across a larger timeframe.
The Instance Logs view in the PowerSync Dashboard now supports search and filtering. You can type user_id:abc123 to isolate one user's logs, filter by error code to find every client running into a specific error, or investigate a usage spike by finding sessions with operations_synced:>1000. Matching entries can also be exported to CSV for offline analysis.
This has been one of our most-requested features, and we're excited to ship it to everyone.
What's new
Search and filter. The search bar accepts free-text terms that match anywhere in an entry, plus structured alias:value filters that match a specific property. Common aliases include user_id, client_id, error, and close_reason. Numeric comparisons like stream_ms:>=500 are supported, and you can also filter on any other metadata property on a log by typing its name or by clicking on the pill to add it as a filter without typing.
Filter on custom client metadata. If your app calls connect() with custom app_metadata, each sync session log includes those properties. Filter on them with the app_metadata_ prefix, for example app_metadata_app_version:1.5.0 to get every session on a specific release.
CSV export. You can export currently loaded entries to CSV, scoped to the active log type, time range, levels, and search query. Narrow the result set with filters first, then download it for offline analysis or aggregation in another tool.
Full reference for the search syntax and CSV columns is in the Instance Logs docs.
Feedback and help
Reach out on Discord or contact us if you run into any issues or have feedback for us.